Social network analysis (SNA) is the process of investigating social structures using networks and graph theory. It characterizes networked structures in terms of nodes or vertex (individual actors, people, or things within the network) and the ties, edges, or links (relationships or interactions) that connect them. I won’t talk too much detail on the SNA theories as you can easily find them on the internet.
There are some sources that provide data for SNA such as Stanford and kdnuggets. In this simple analysis, I extract Twitter retweet data using “twitteR” package and analyse network retweet of a certain topic using “igraph” package in R. This tutorial from cosmopolitanvan may help you to replicate this work.
As one of the largest social networks on the Internet, Twitter can be used for expanding your business or website's audience. It is free to create an account, it is easy to start tweeting to promote your work or share your ideas and thoughts. Twitter has 284 million monthly users as of December 2014, according to Trusted Reviews.
It’s fun to analyse Twitter’s retweet data, we can see how users interact with each other retweeting a certain topic on a certain time, identify which user gets many retweets, and make a conclusion of the user’s preference e.g. political preference. It is also not surprising to see a lot of public figures retweet each other intensively.
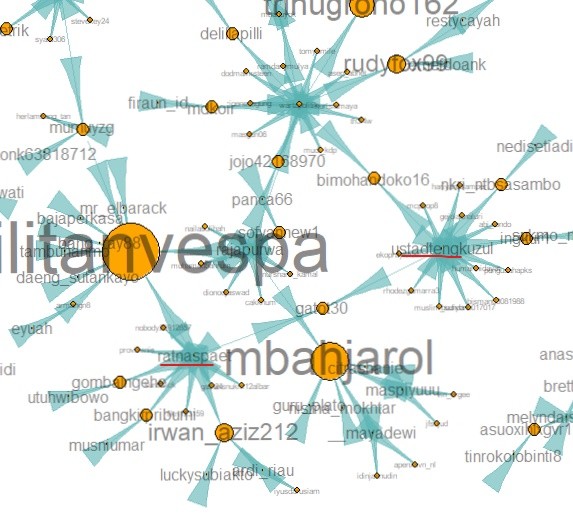
The network graph below shows Retweet Network of #Jokowi, President of Indonesia, from 500 Twitter users (I use only 500 data since network analysis and visualization is computationally intensive). Size of yellow nodes can refer to indegree or outdegree centrality. In this case, it reflects indegree centrality or number of retweet a user gets. The biggest vertex or node belongs to @militanvespa which means this user gets the highest number of retweet on a certain time. We also can detect visually which user has high outdegree centrality or number of retweet a user does, the shape of the network looks like a “star”.

It’s interesting to see some public figures retweeting to each other, as what kind of idea/tweet regarding “jokowi” these users have shared or reposted is a different matter to discuss (we can check their tweets or guess based on the latest news). It is also important to describe the “specific time” in this analysis since it would not be relevant as the retweets may change in every minute or hour. We may also detect which account is suspected as a “buzzer” or social media influencer.
There is other useful statistics in “igraph” package which is betweenness centrality. Betweenness centrality is to measure how often a node lies on the shortest path between two other nodes. The more a node appears on one of those shortest paths, the higher its betweenness centrality. @militanvespa has the highest betweenness centrality, this user can be called a broker which means that information needs to pass through that entity to be shared by the other nodes. This also means that by cutting this node, chances are the network will fall apart into unconnected components.
Comments
Post a Comment