Developed countries are viewed as having high contribution of the Manufacturing Industry Sector (Bahasa: Sektor/Kategori Industri Pengolahan) in the economic structure (Gross Domestic Product). Most economists agree that a country can be viewed as developed country if the contribution of the Manufacturing Industry Sector reaches a total of 30 percent of the total Gross Domestic Product (GDP).
What about Indonesia's Economy? BPS-Statistics of Indonesia (National Statistics Office), in January 2018, reported that Indonesia's economy in 2017 measured by Gross Domestic Product (GDP) at current prices reached Rp 13,588.8 trillion and GDP per capita reaches Rp 51.89 million or US$ 3,876.8. Indonesia's economy grew (c to c) 5.07 percent higher than the economic growth in 2016 (5.03 %). The highest growth was achieved by the Information and Communication Sector which was 9.81 percent.
The structure of Indonesia's economy was dominated by three main sectors: Manufacturing Industry (20.16 %); Agriculture, Forestry, and Fisheries (13.14 %); and Large-Retailer, Car-Motorcycle Repair (13.01 %). The manufacturing Industry Sector never contributes more than 30 percent, this sector has been contributing around 18-20 percent for the last ten years. Indonesia should be able to boost its manufacturing industry since it still has high availability of raw material, numerous labors, big markets, and decent facilities to support industry activities.

Provinces in Java island still give the highest contribution to the GDP which is 58.49 percent, followed by the provinces in Sumatra island which contribute 21.66 percent, Borneo island 8.20 percent, Celebes island 6.11 percent, and other small islands 5.54 percent. This is not surprising since most of Indonesian live in Java island, it is estimated that around 56 percent of Indonesia population will live in Java island in 2020. We can assume that the more people who live in a region, the more productive it will be.
You can see the other data through my visualization project in here
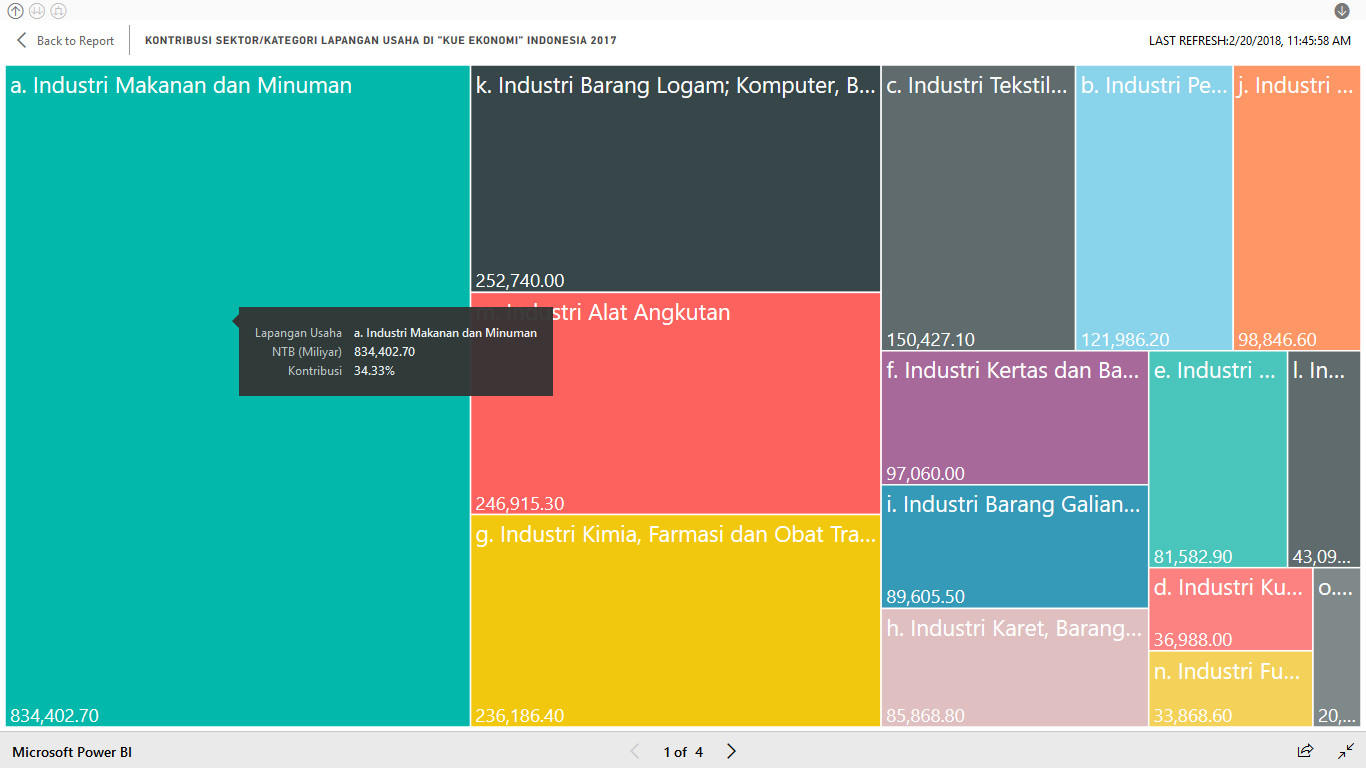
Investing in Food & Beverage Industry? Indonesia is an agrarian country, this is also supported by the large number of workers working in the Agricultural Sector which is 35.93 million people or 29.69 percent of total workers (SAKERNAS-BPS, August 2017). The amount of workers absorbed by the Agriculture Sector should create an opportunity to produce abundant agricultural products. Therefore, processing agricultural products (including fishery, plantation, livestock, and so forth) should be the main industry such as food and beverage or textile manufacturing industry. In fact, the Food and Beverage Industry (Bahasa: Industri Makanan dan Minuman) is one of the sub-sectors that has been giving the largest GDP contribution to Non-Oil Processing Manufacturing Industry Sector for the last seven years and having high growth rate (more than 7% per year) for the last four years.
What does the future hold? the data showed that Information and Communications Sector has been growing rapidly (more than 8% per year) for the last five years. We live in the different economic world compared to ten years ago because of the growing of information technology. Nowadays, it is common to see the trading between buyers and sellers, especially in big cities, through the internet. The buyers can gain many information about the supplies and the prices of the goods and services easily while the sellers know about the varieties of the demanded goods and services. Growing in information technology will create new competitions and innovations in the market, intuitively this should boost the productivity in the economy. In the end, businesses which can adopt useful information technology quickly will survive.
So, is this the reason why nowadays we can find various kinds of local processed foods? Is this the signal that food and beverage businesses are able to adopt information technology successfully? Food and Beverage Industry may continue to flourish as the technology will continue to grow in the future. Let's buy those local foods to help the economy.
Comments
Post a Comment